How to Calculate First-Purchase Conversion Rate in a Mobile Game
 Mario F. Machado·2026-05-20
Most studios track payer conversion but measure it wrong: mixing up denominators, benchmarking against the wrong genre, and missing the window that actually matters. Here's how to calculate it correctly and what to do with the number.
The calculation is two lines. Divide new payers by monthly active users, multiply by 100. Most studios can do that in a spreadsheet today.
What most studios can't do is tell you whether 2.3% is good for their genre at their lifecycle stage, why the number is what it is, or which layer to address first when it's too low. The calculation is the easy part.
Fewer than 1 in 20 active players in a typical mid-core mobile game will ever make a purchase.[1] Most studios know that. Fewer know whether their game is performing at 1.5% or 4.5%, and almost none can articulate why the gap exists.
This guide covers how to calculate first-purchase conversion correctly, what the benchmarks actually say, and what the number tells you about where to look next.
What this rate actually measures
First-purchase conversion rate answers one question: of the players who could pay, how many do?
The ambiguity is in "players who could pay." Different sources define this differently, and the choice of denominator can change your rate by a factor of three or more.
The formula:
First-Purchase Conversion Rate = (New Payers in Period / MAU in Period) × 100
"New payers" means players making their first-ever IAP, not repeat purchasers. This is the first-purchase rate specifically. If your analytics platform surfaces "payer conversion" without distinguishing first vs. repeat, you're measuring the wrong thing.
What the benchmarks say
In most mid-core mobile games, fewer than 1 in 20 active players ever makes a purchase.
The industry consensus from multiple practitioner sources places the freemium mobile game range at 2%–5% of MAU, though most mid-core titles cluster below 3.5%.[1][2] Within that range:
- Around 2%: Floor of the typical range. Studios at this level usually have a functional store but an unconvincing first offer or poor timing.
- 2%–3.5%: Typical. Most mid-size studios operating without dedicated monetization focus land here.
- 3.5%–5%: Top-performer territory for mid-core. Studios at this level have usually done significant work on the first-purchase funnel. Social casino titles exceed 8% by genre design, but for Strategy or RPG, reaching 3.5% is a meaningful threshold.[2]
Before you benchmark your game against these numbers, it's worth knowing where they come from.
Genre changes the benchmark meaningfully
A 2.5% conversion rate means something different in a casual puzzle game than in a mid-core Strategy title. The populations are different: puzzle players are acquired at volume and lower intent; Strategy players self-select for depth and are more likely to pay once the hook lands.
The only comparison that means anything is same genre, same lifecycle stage. A gacha RPG at day 90 vs. a 4X Strategy title at day 30 tells you nothing.
The platform split matters too
MAF's research shows store-page-to-install conversion for Strategy at roughly 6% on iOS and 10% on Android.[3] Android brings in more downloads relative to store page views, but iOS players show higher retention and in-app spending once they install. A higher install rate doesn't translate to a higher payer rate.
This matters when reading MAU-based payer conversion benchmarks. An iOS MAU is a more self-selected population than an Android MAU of the same size: higher-intent players who cleared a more selective install funnel. Comparing your iOS payer conversion rate directly against an Android-skewed industry benchmark can make your numbers look worse than they are.
The timing problem most studios miss
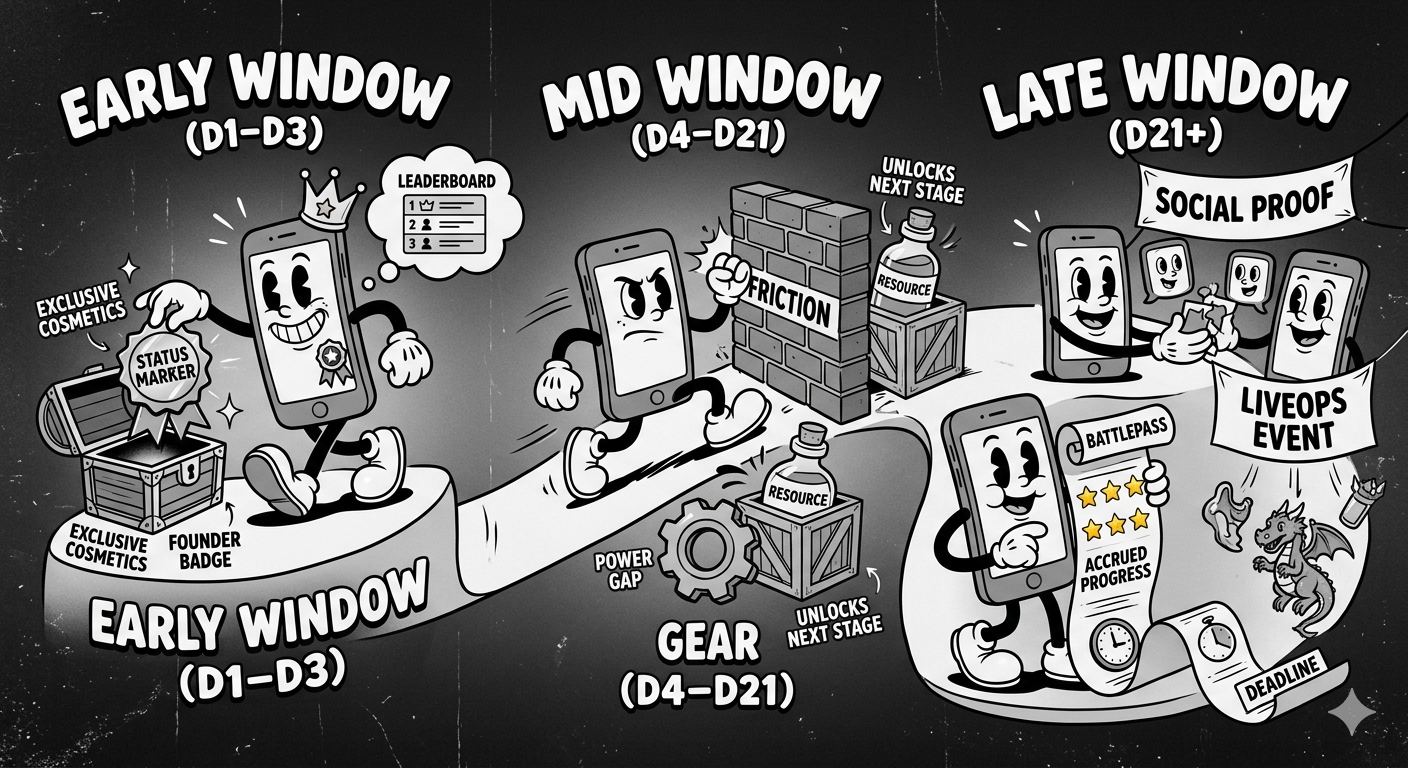
Knowing your conversion rate matters less than knowing when conversion happens, and whether you're doing anything to influence it.
AppMagic's research on 4X Strategy monetization found that only 3% of users move from the $10–$100 spending segment to the $100+ segment between day 30 and day 90.[4] The spending tier a player lands in is largely fixed by the end of that first month.
The first-session conversion window is the highest-leverage moment in a player's monetization lifecycle. High-intent spenders who aren't reached early often don't come back, and the tier they land in on the way out is the tier they stay in.
Solar Engine documented a case study where 55% of new players never saw the initial first-purchase offer at all. It was buried behind tutorial skip flows and loading delays. Of those who did see it, 68% clicked items but didn't purchase (weak value perception), and 43% dropped during the payment stage.[1]
After fixing timing, value framing, and payment friction, conversion lifted from 3.2% to 5.8% (an 81% improvement). Post-purchase ARPPU rose 40% in the same period.
None of those fixes touched the price. They made the offer visible, legible, and present at a moment when the player actually wanted to buy something.
How to read your own number
The conversion rate tells you whether you have a problem. It doesn't tell you where the problem is.
A 1.8% rate could mean players aren't reaching the store, or that they're reaching it but not seeing a compelling offer, or that they're seeing the offer but abandoning at the payment step. Each of those is a different fix. Applying the wrong one wastes time while the window closes.
Getting clean answers requires funnel-level analytics instrumentation that most studios aren't tracking consistently. Store entry rate, offer view-to-purchase rate, and time-to-first-purchase are the right questions, but they rarely come pre-packaged from a single analytics tool. Mapping the funnel clearly is usually the first step before any prioritization work can happen. Where the constraint actually lives determines whether the fix is a store placement change, an offer redesign, or a payment flow audit. Those are three different projects.
What conversion rate doesn't tell you
A high payer conversion rate isn't automatically good news. The trap most studios fall into is optimizing conversion by reducing entry price until it works, then discovering they've set a low spending anchor for every player they convert.
Deconstructor of Fun's 2024 survey found that 85.2% of developers prioritize getting users to make a purchase quickly over pricing at maximum willingness-to-pay. 61.1% believe it's safer to underprice. And 96.3% would price starter packs below $10, with 59.2% going below $5.
The problem with a $0.99 starter pack isn't that it doesn't convert. It's that it sets the player's permanent price anchor. Every subsequent offer gets evaluated relative to that first price. A player anchored to $0.99 will hesitate at $9.99 in a way that a player anchored to $4.99 won't.
Eric Seufert's analysis at Mobile Dev Memo puts the decision rule clearly: until a game reaches the 7%–8% conversion ceiling that caps the freemium model, widening the payer base moves more total revenue than deepening spend from existing payers. But the conversion work that matters is funnel timing and offer design, not price reduction.
The goal is more players who convert, not a lower barrier until almost anyone will.
The calculation in practice
Here's a worked example for a mid-core RPG:
The formula surfaces the question. Where the answer lives is a different investigation.
◆ References
- 1.Solar Engine From Player to Payer: The Guide to Cracking First-Purchase Conversion in Mobile Games
- 2.Game Growth Advisor The 20 Mobile Game KPIs That Actually Matter in 2026
- 3.MAF Conversion Rates, IPM and IAP Benchmarks for Mobile Games (2026)
- 4.AppMagic An In-Depth Look at 4X Strategy Monetization: Two Ways to Win

Mario F. Machado
Founder, LootRate
Founder of LootRate. Previously Lead Product Designer at WB Games, where he built the D2C revenue infrastructure for six live mobile titles. LootRate audits mobile game monetization across 14 dimensions and identifies the highest-leverage experiments studios aren’t running.
Where does your game score on First-Purchase Conversion?
Friction and incentive design on the critical first payer conversion event. A 30-minute intro call is a straight conversation about your game's revenue and whether bringing in an owner makes sense.
▸Talk through your revenue30 minutes. A straight conversation about your revenue.
◆ The intro call
- A conversation about your game's revenue and goals
- Where the upside likely is, and what owning it looks like
- Whether we're the right fit to take it on